English
 Italiano
Previous Story
Legislative elections in Austria
By Marta Regalia
23/10/2017
Legislative elections were held in Austria on 15 October 2017. The 183 members of the National Council are elected by an open list proportional representation system in nine multi-member constituencies (from 7 to 36 seats) based on the states and 39 sub-constituencies. At the sub-constituency level, seats are allocated using the Hare method, while at the federal level the D’Hondt method is used. In order to get representation, parties must overcome the 4% electoral threshold or one seat in one of the 39 sub-constituencies. Voters can cast a party vote and one preference votes on each level. To move up list order, candidates must obtain a specified percentage of the votes (7% of the candidate’s party result on the federal level, 10% on the state level and 14% on the electoral district level).
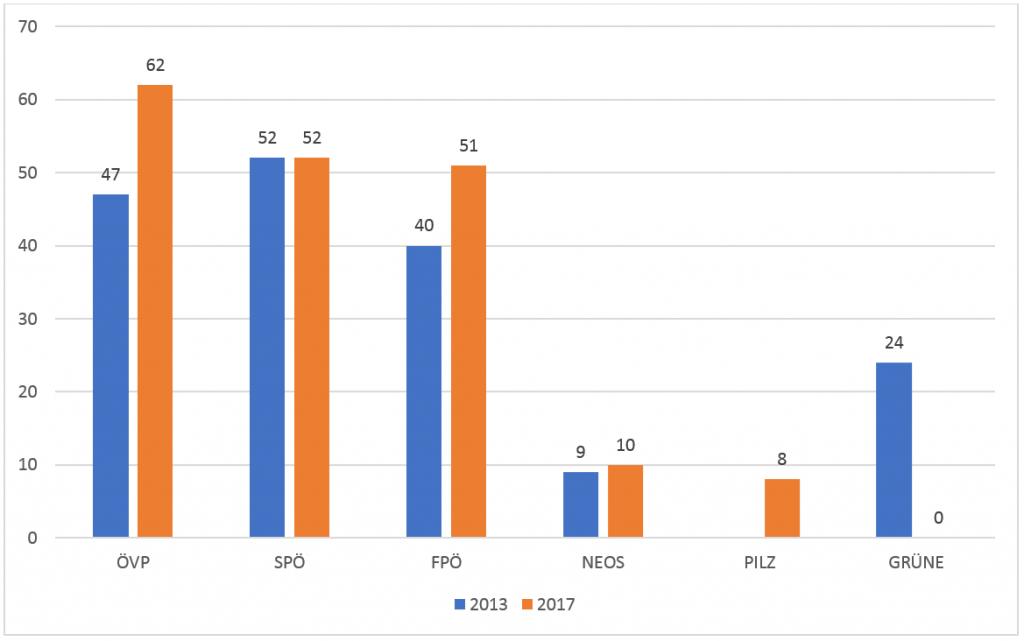
Among the sixteen parties that qualified to contest the elections, only five were able to get representation. The Austrian People’s Party (ÖVP) emerged as the largest party in the National Council and saw a strong increase in its number of seats, passing from 47 to 62 of the 183 seats (Figure 1). The Social Democratic Party (SPÖ), that was the largest party after the previous elections and had led the government since 2007, finished second with 52 seats (the same number of seats than in 2013), slightly ahead of the Freedom Party of Austria (FPÖ), which received 51 seats (it gained 40 seats in 2013). 10 seats went to The New Austria (NEOS), and Peter Pilz List (PILZ, which split from the Green Party at the start of the campaign) entered parliament for the first time with 8 seats. The Green Party failed to cross the 4% threshold and lost its 24 seats.
Thus, these elections showed one real winner and one real looser. The former is Kurt’s ÖVP, while the latter is the Green Party, that was not able to enter the parliament.
Figure 1 – Number of seats in 2013 and 2017 of the six most voted parties in 2017
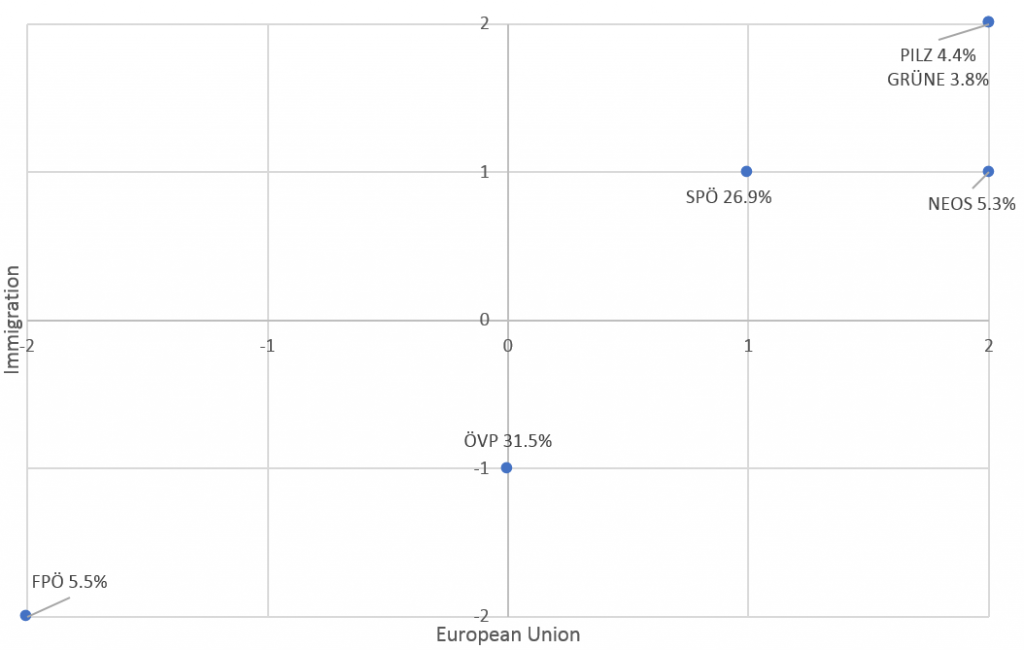
If we frame these results in terms of attitudes toward immigration and the European Union (Figure 2), we can see that 40.4% of the votes were casted in favour of parties which have a positive standing toward the EU (SPÖ, NEOS, PILZ and GRÜNE), while only 5.5% in favour of anti-EU parties (FPÖ).
The situation is different if we look at immigration. 37% of the electorate voted for parties (FPÖ and ÖVP) that want a more severe immigration policy or that are strongly anti-immigration. On the contrary, only 40.4% of the votes were casted in favour of parties with a more positive standing on immigration (SPÖ, NEOS, PILZ and GRÜNE).
Figure 2 – Austrian parties’ positions on immigration and European Union